

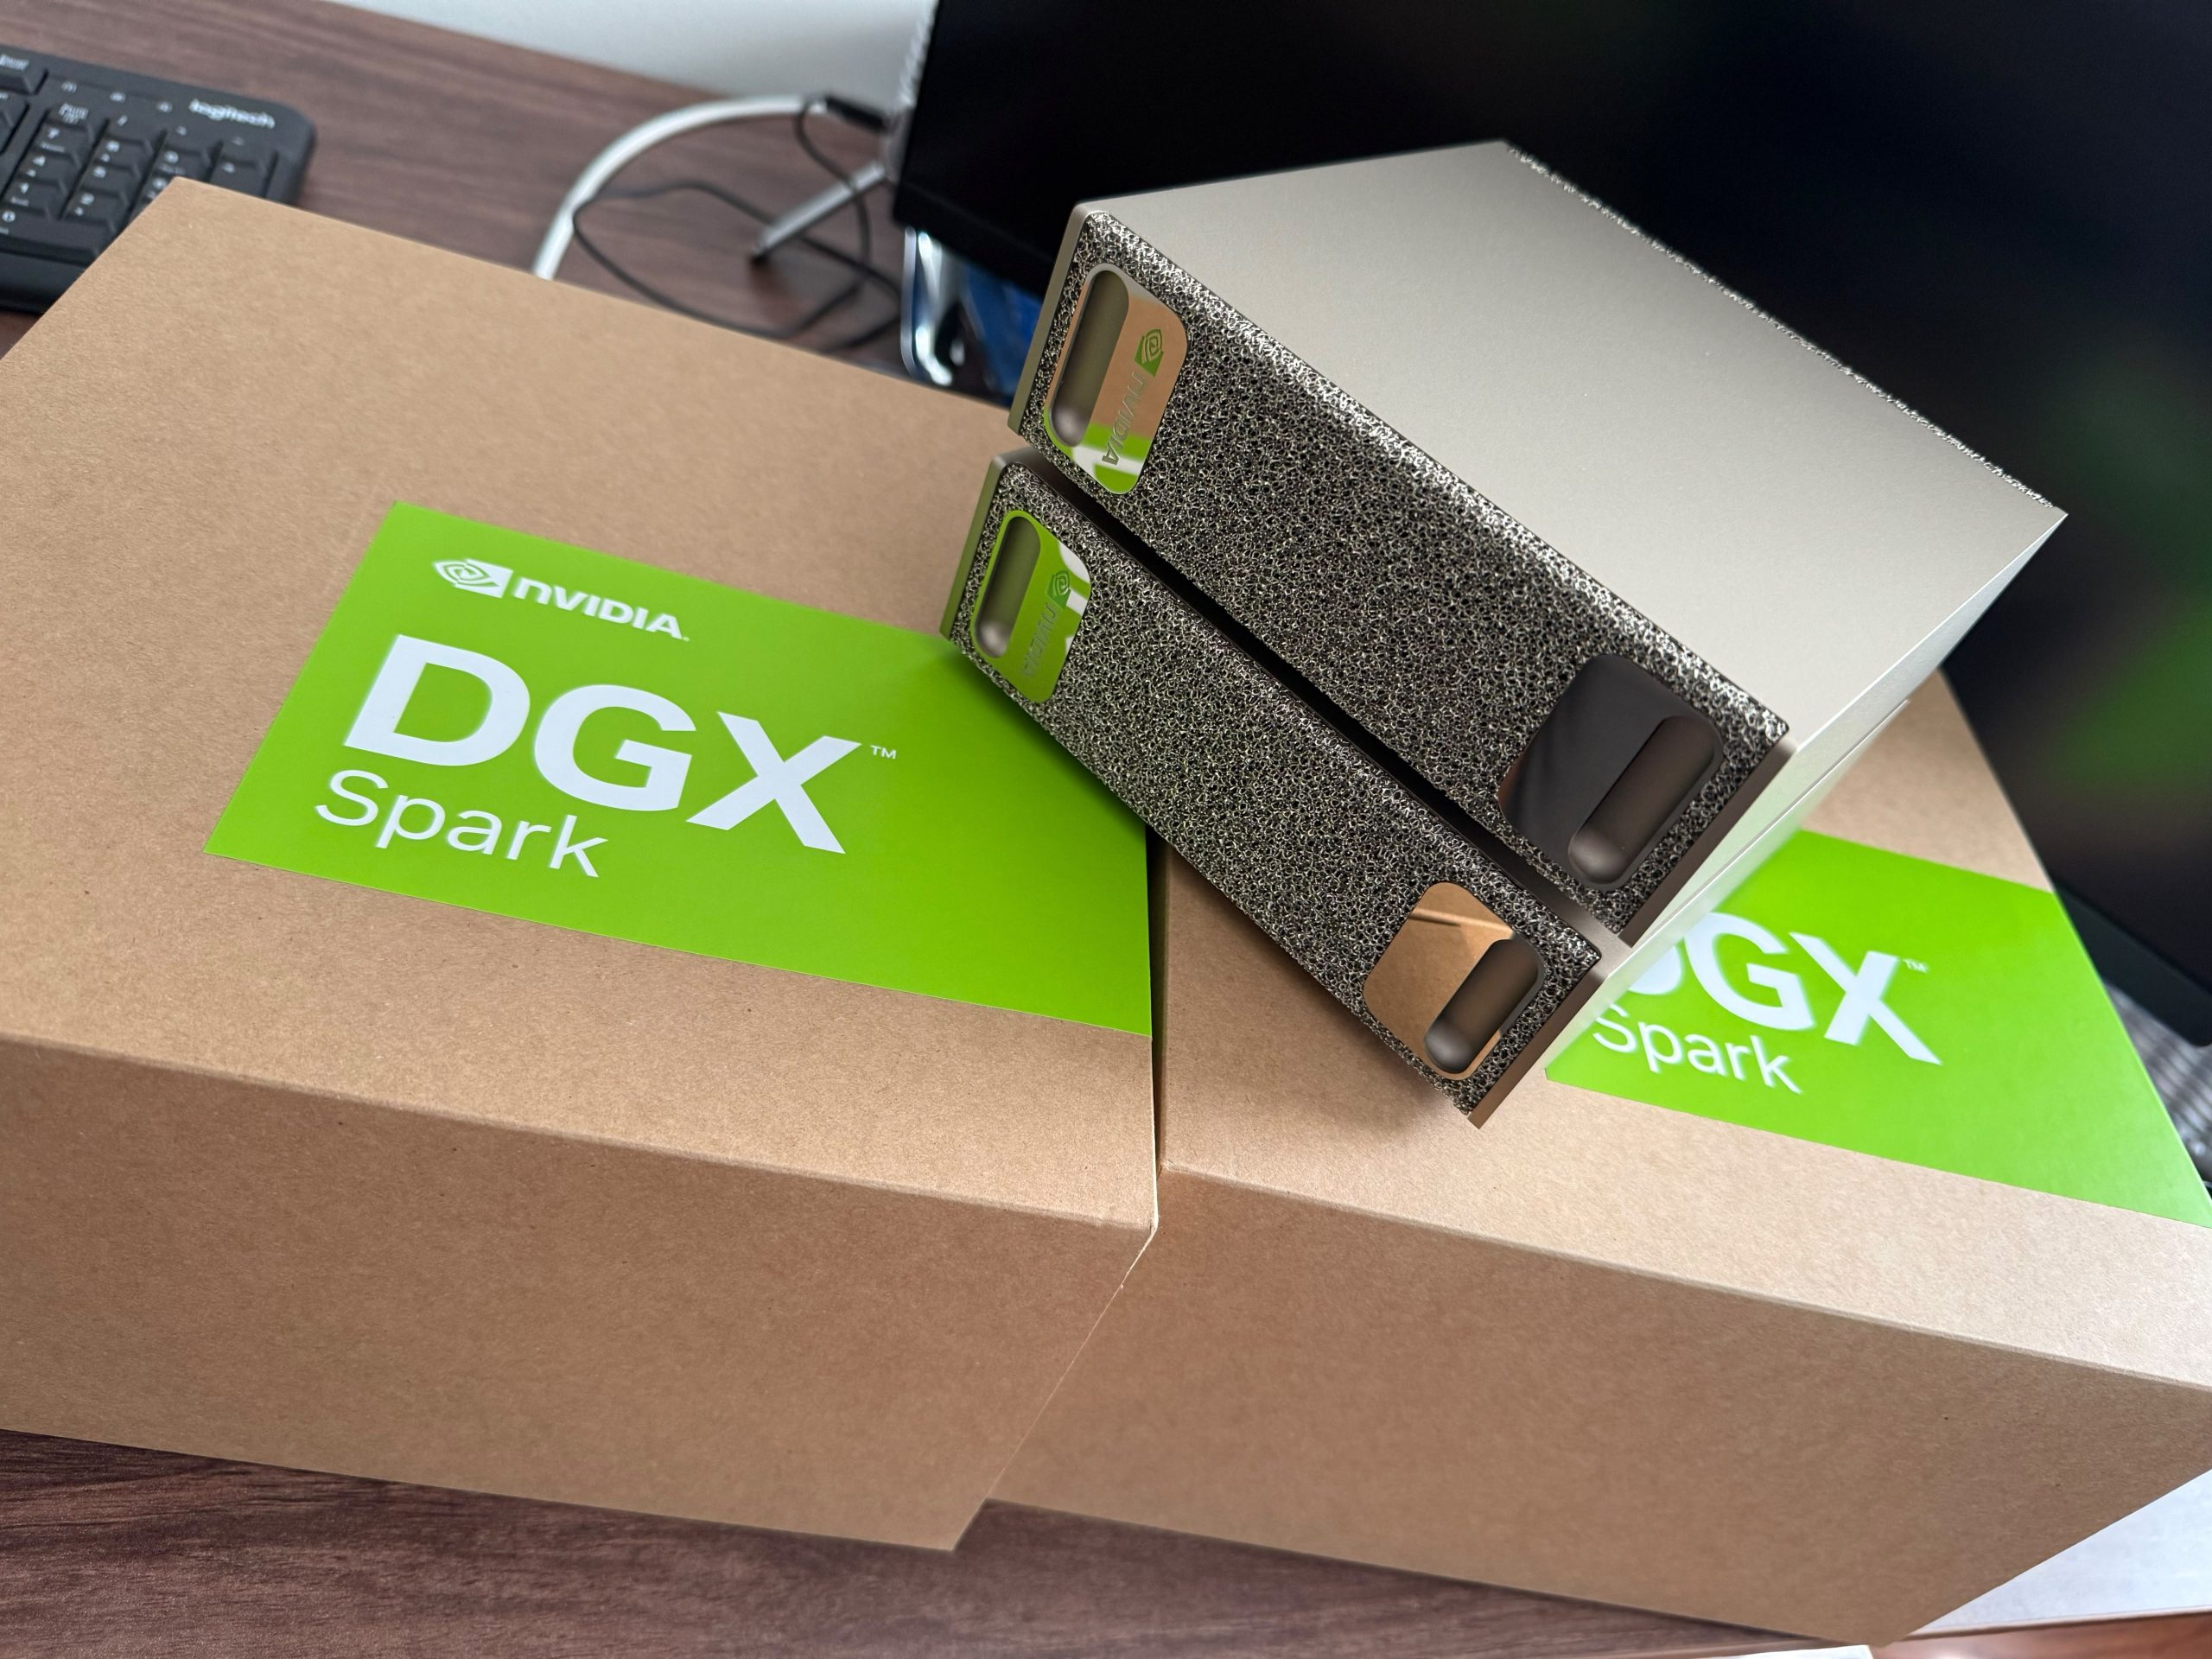
The two NVIDIA DGX Spark nodes arrived on August 10. Since then I've been running deepseek-ai/DeepSeek-V4-Flash-0731 on them, on a plain-venv port of vLLM 0.27.1 with CUDA 13.3, working toward an eventual upstream PR that makes this pairing work out of the box. Speed was never the problem. The port hit 64.6 tok/s on coding prompts and 69–70 tok/s on HTML generation in the first day, with 78–89% draft acceptance against the model’s own speculative head. Correctness took the six days after that. By the time the stack settled down I had found thirteen distinct bugs spread across six layers of the serving stack. This post covers all thirteen, and goes deep on the five that took the longest to find, with the math behind each failure and each fix.

The model, briefly
DeepSeek-V4-Flash-0731 is a mixture-of-experts model: 284B total parameters, 13B active per token. That’s a sparsity ratio of
\frac{P_{\text{active}}}{P_{\text{total}}} = \frac{13\text{B}}{284\text{B}} \approx 4.6\%
It pairs a hybrid sparse-attention stack (Compressed Sparse Attention plus Heavily Compressed Attention) with Manifold-Constrained Hyper-Connections, and DeepSeek reports that combination reaching 27% of V3.2’s per-token inference FLOPs and 10% of its KV-cache footprint at 1M context. Expert weights ship in MXFP4, attention/norm/router parameters stay in FP8. A Lightning/DSA indexer picks a sparse set of attention positions per token instead of attending densely. That’s the mechanism behind the 10% KV number, and it’s also where two of the bugs below turned out to live.
Only the 0731 checkpoint matters here (sha 7872f01b, dated 2026-08-01, 166.9 GB). Two lookalikes trip people up, and one of them tripped me up too, because a third-party recipe’s .env file defaults to it: deepseek-ai/DeepSeek-V4-Flash is an earlier preview whose README opens with “We present a preview version,” and deepseek-ai/DeepSeek-V4-Flash-DSpark is dated 2026-07-04, four weeks older. All three share an architecture, so shard counts and file sizes look almost identical; only the checkpoint date and the README tell them apart. 0731 already ships the DSpark/MTP draft head as part of the base checkpoint (72,317 tensors, 4,705 of them mtp.*), so there’s no reason to layer the DSpark repo on top of it.
Why it's worth the effort
Thirteen bugs is a lot to spend on one model, so let me be specific about why this one earned it. In DeepSeek’s own release benchmarks, V4-Flash-0731 (the 13B-active checkpoint this whole post is about) beats GLM-5.2 on most of the agentic and coding benchmarks that matter for this kind of use: Terminal Bench 2.1, 82.7 vs 81.0. Cybergym, 76.7 (GLM-5.2 wasn’t reported). DeepSWE, 54.4 vs 46.2. Toolathlon-Verified, 70.3 vs 59.9. Agents’ Last Exam, 25.2 vs 23.8. AutomationBench, 25.1 vs 12.9. Both DSBench splits, 68.7 vs 61.8 on full-stack and 59.6 vs 54.5 on hard.
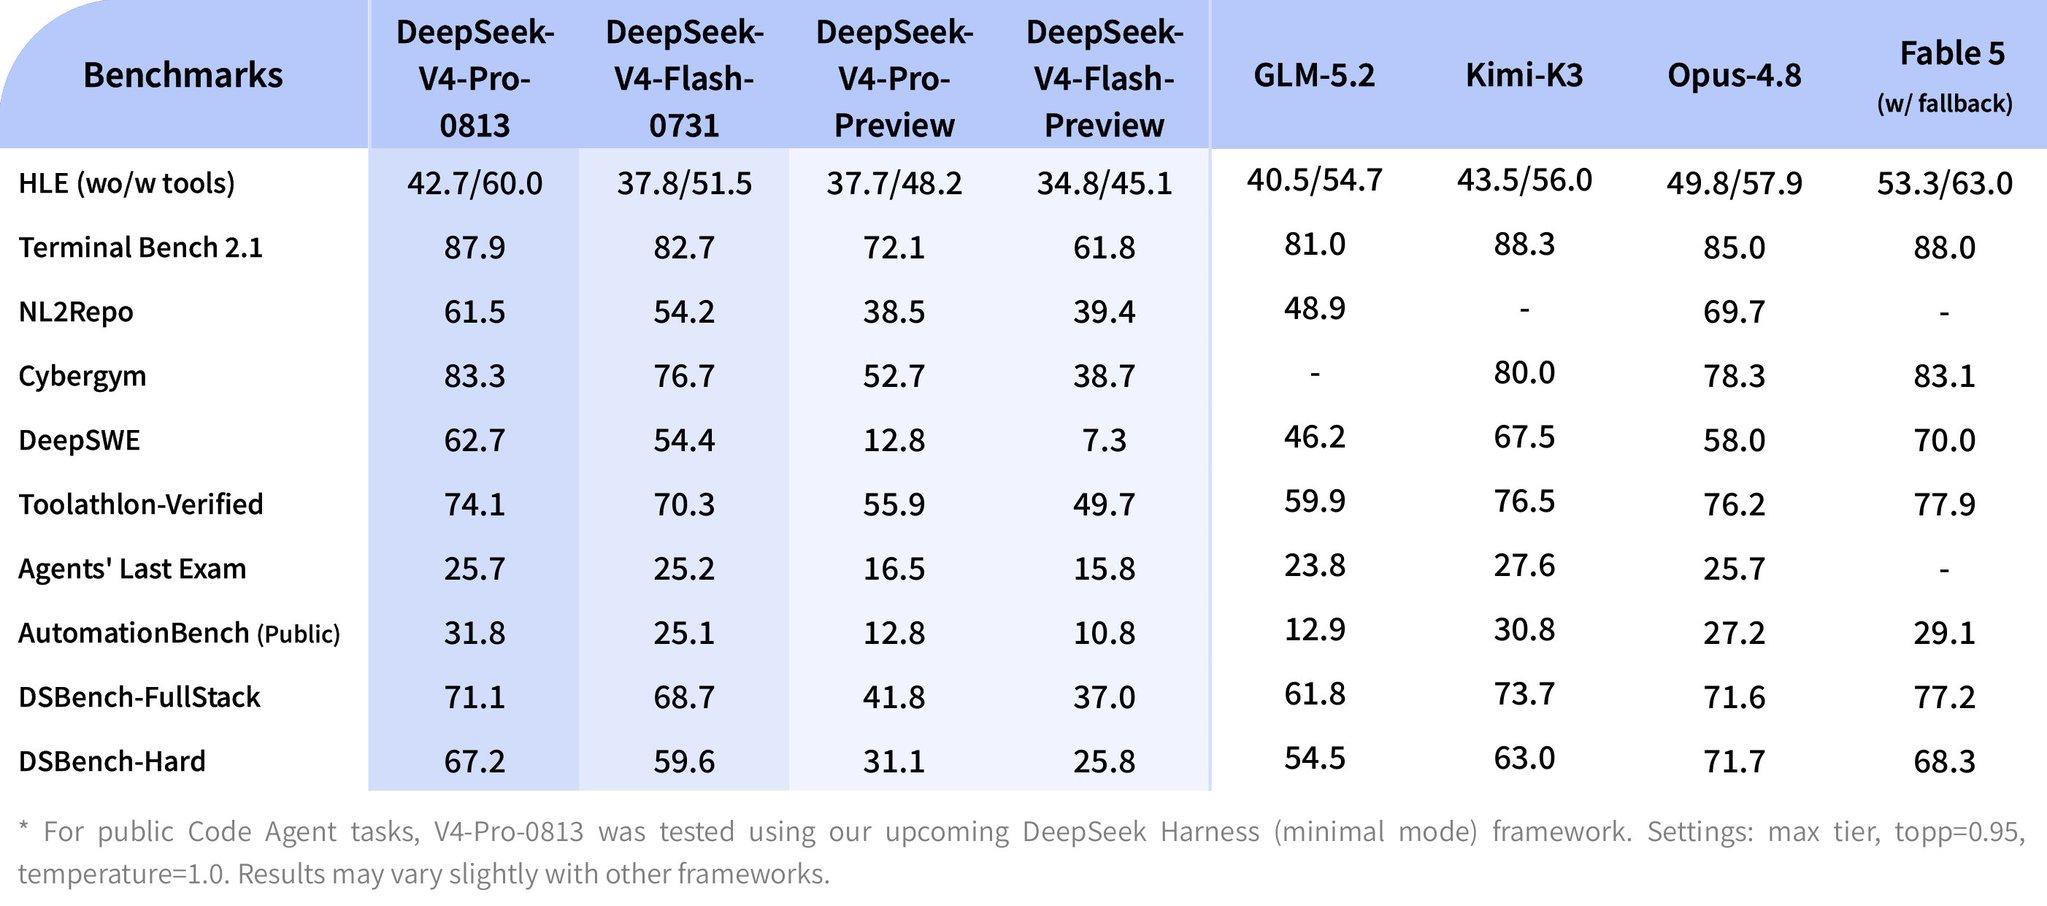
It trails Kimi-K3, Opus-4.8, and Fable 5 on most rows, and it trails its own much larger sibling V4-Pro-0813 everywhere. That’s not surprising for a model running at roughly 4.6% of the active parameters (the ratio from the section above). The narrower point, and the one that actually matters for two DGX Sparks, is this: at the active-parameter budget two 128 GB unified-memory boxes can hold and run at a livable speed, this is about as good as it currently gets. It’s not a compromise pick. That’s why a week chasing thirteen bugs made more sense than settling for a smaller model that would have needed none of them.
The hardware and the port
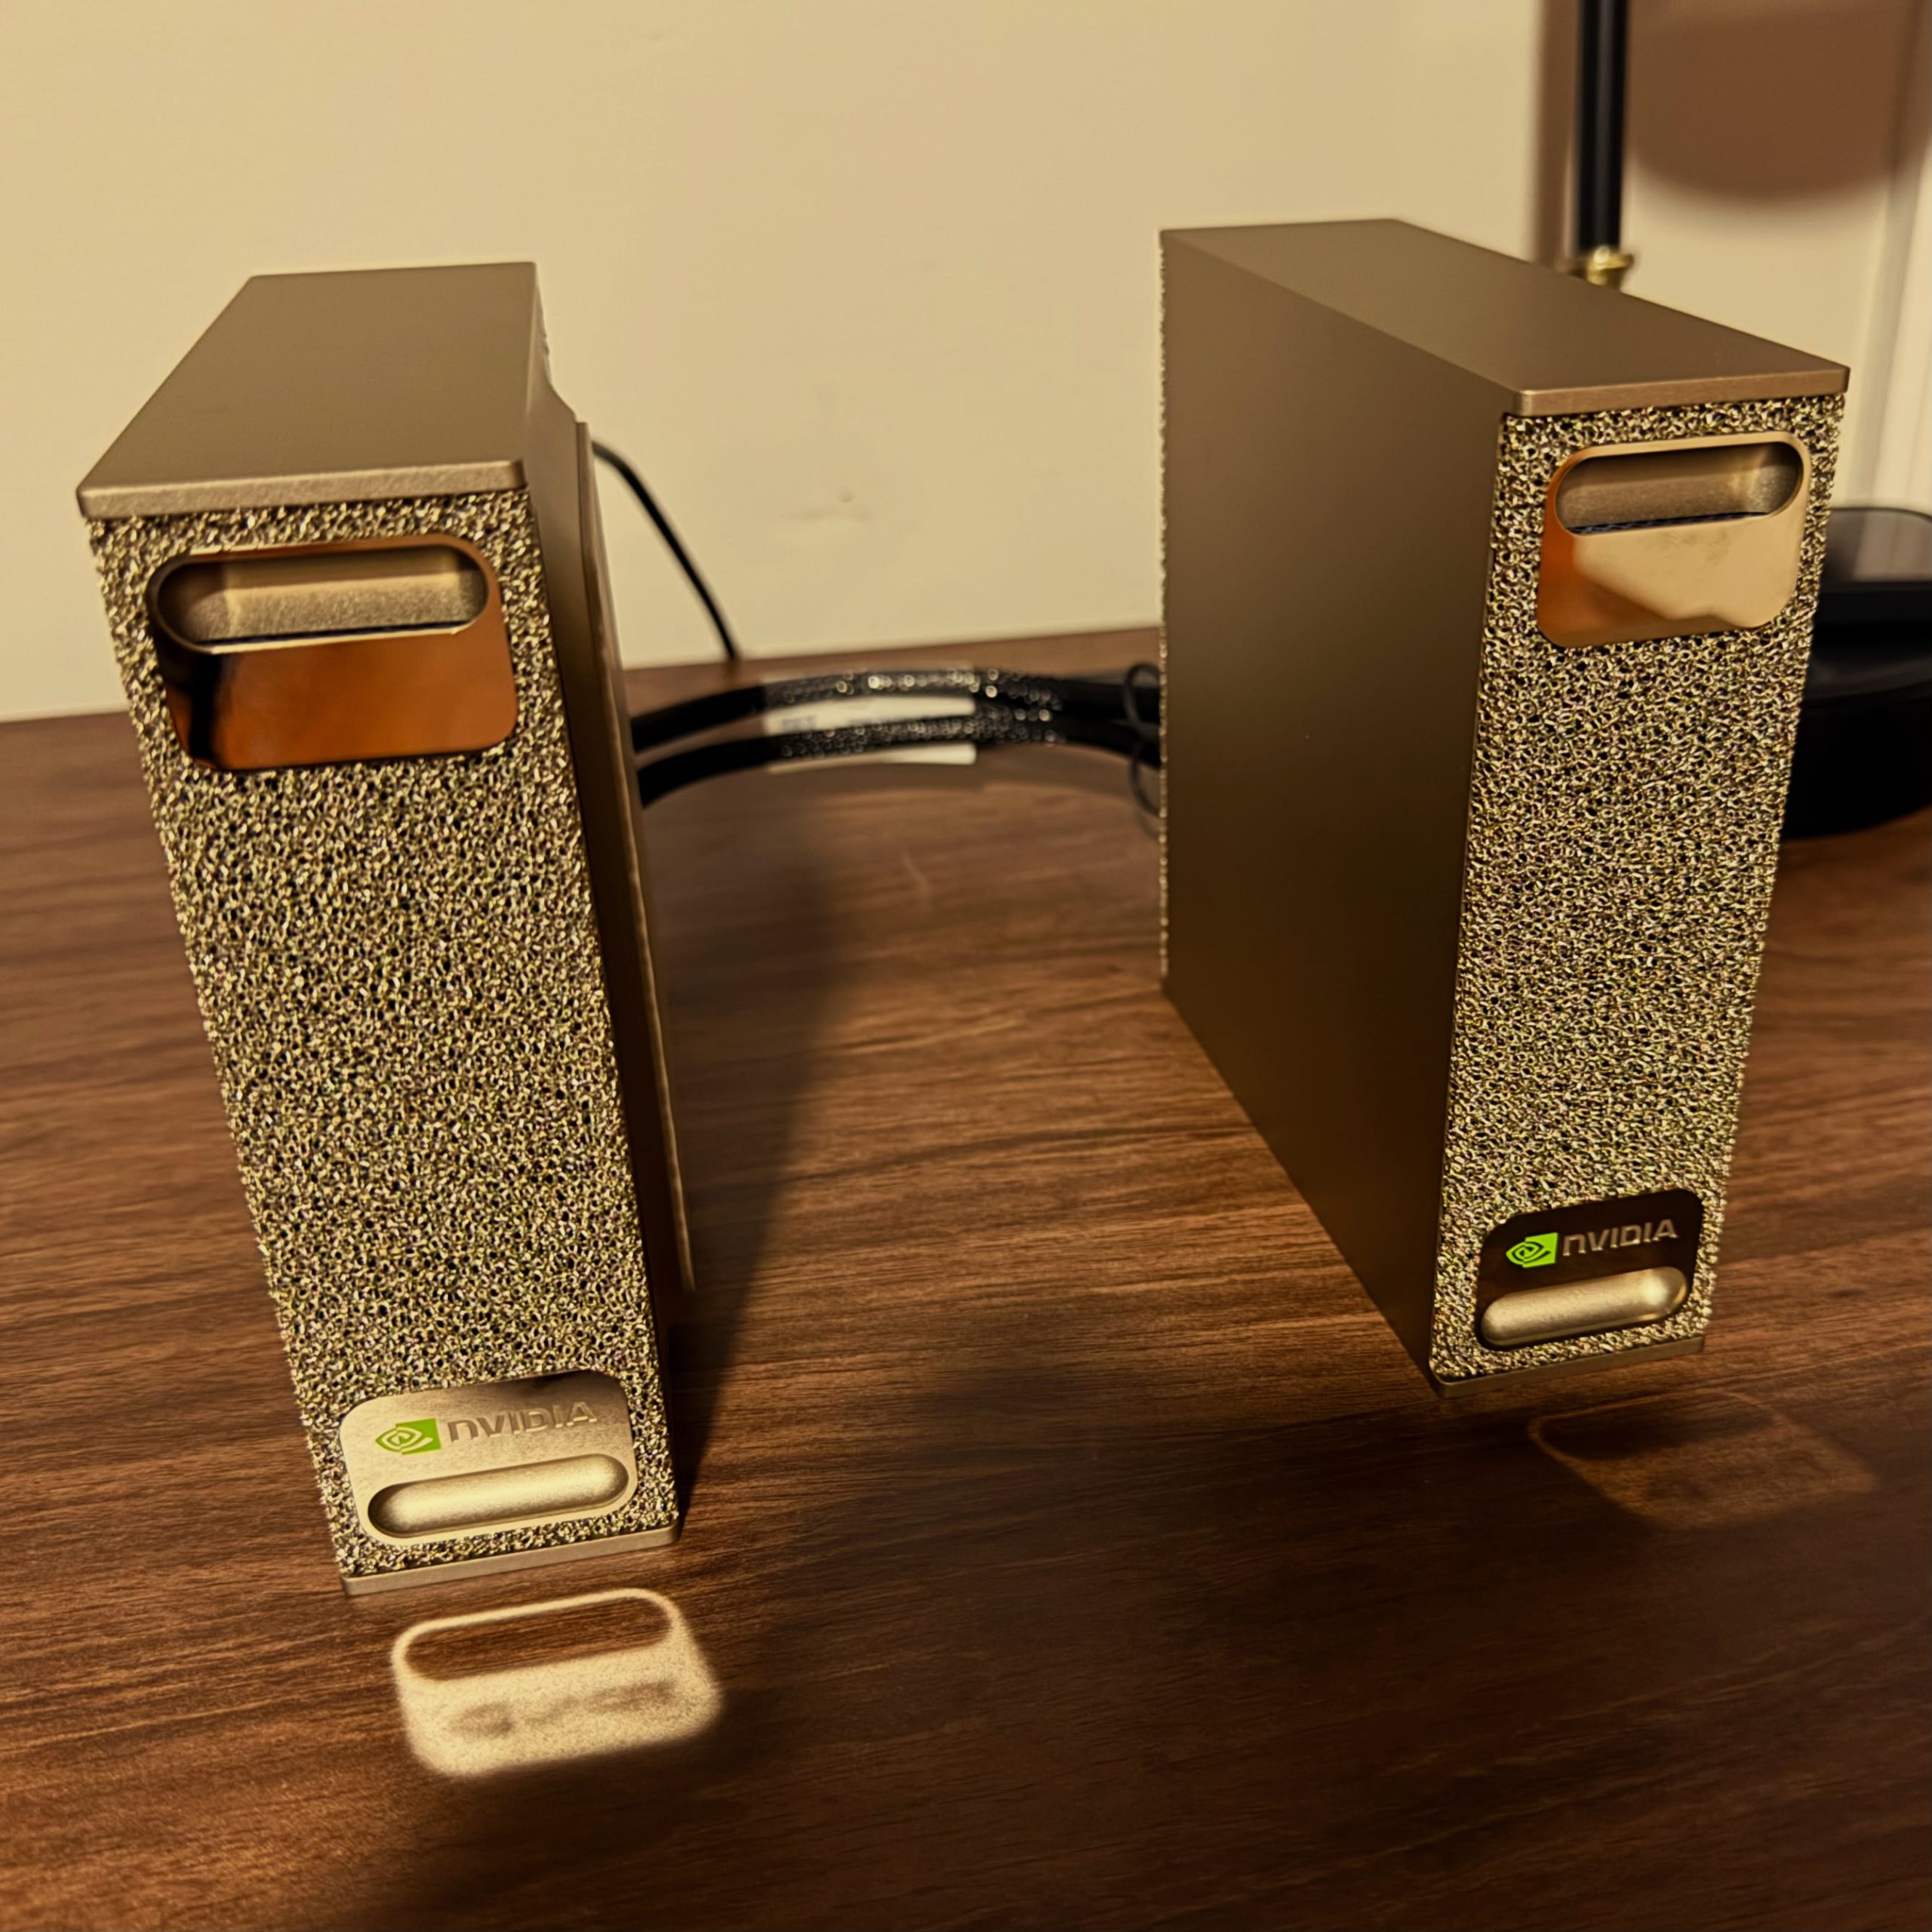
The two Sparks (GB10, sm_121a) are connected directly with two QSFP DAC cables into the ConnectX-7 NIC’s two cages, running tensor-parallel size 2 across the pair. One cable alone already gets close to line rate, about 196 Gb/s aggregate across its two PCIe partitions. The second cable only adds about 13% more, up to roughly 221 Gb/s. I keep both plugged in anyway. The real reason is redundancy and link stability, not the extra bandwidth. Getting either cable up to its rated 112 Gb/s per partition took one non-obvious step: if you cable the QSFP ports while a node is already booted, the NIC firmware misreports PCIe slot power and throttles the link to about 13 Gb/s no matter what you do with message size or queue depth. The fix is just to reboot with the cables already seated.
On top of that fabric, I ported an earlier 0.21-RC container stack to a plain venv on vLLM 0.27.1: Marlin MXFP4 MoE, FULL_AND_PIECEWISE CUDA graphs, and later CUDA 13.3 installed side by side with 13.0. The driver stays at 580.173.02 on purpose. A driver bump broke GB10 detection for other people on this hardware, and nvidia-smi still reporting “CUDA 13.0” afterward just means that’s the driver’s max-supported version, not that the upgrade failed. The port-0271 branch on my vLLM fork, based on the v0.27.1 tag, is the staging ground for a PR I want to eventually get onto vLLM main. That branch is where all thirteen fixes below actually live.
Thirteen findings, six layers
Before I go deep on any single bug, here’s the full inventory. No one layer of the stack was responsible, and where these things hid turned out to be a finding in itself. Ordered by where each one sits on the path from a cold boot to a served token:
\begin{array}{c} \boxed{\text{1. Config \& CLI resolution, kernel-bucket dispatch}\ \ (\#1,\#2,\#3,\#4,\#5)}\\[4pt] \downarrow\\[4pt] \boxed{\text{2. Platform introspection \& persistent adaptive-profile cache}\ \ (\#6,\#7,\#8)}\\[4pt] \downarrow\\[4pt] \boxed{\text{3. KV-cache dtype \& packed-layout definition}\ \ (\#9)}\\[4pt] \downarrow\\[4pt] \boxed{\text{4. KV block allocator}\ \ (\#12)}\\[4pt] \downarrow\\[4pt] \boxed{\text{5. Sparse-attention metadata builders: indexer, SWA, C128A}\ \ (\#10,\#11)}\\[4pt] \downarrow\\[4pt] \boxed{\text{6. CUDA-graph capture \& replay}\ \ (\#13)} \end{array}
Layer 1 showed up during bring-up, before the model ever answered a real request, and every bug there was a hard crash or a deterministic hang. Annoying, but honest: the thing just stopped. Everything from layer 3 down only showed up under real load, after the server had been running correctly for hours, and every one of those bugs was a silent wrong answer instead of a crash. That’s the pattern for the whole week: loud failures early, quiet ones late.
Layer 1: getting the model to boot at all
- #1, block-size dispatch gate. vLLM’s SM120 decode kernels only dispatch when the packed-KV page block size is exactly 64 (
_DECODE_DSV4_PAGE_BLOCK_SIZE = 64, heads 8–128, top-k in {128, 512, 1024}). The container-inherited--block-size 256failed that check for small batches, which fell through to a prefill-only orchestrator and crashed warmup withCheck failed: num_tokens > 64 (5 vs. 64): Decode must go through sparse_mla_sm120_decode_dsv3_2/dsv4. - #2, a ZeroDivisionError from switching to block 64. DSv4’s compressed-MLA layers carry a
compress_ratioof 128 in the checkpoint, sostorage_block_size = 64 // 128comes out to zero. Block 64 was the wrong lever in the first place: the sliding-window cache already hardcodes block size 64 upstream. The real fix left the main store at 256 and let SWA keep its own 64. - #3, a top-k value with no dispatch bucket. The DSpark draft layer called the decode kernel with a top-k of 256, and the SM120 dispatch table only has buckets at 128, 512, and 1024. Fix: pad the index tensor up to the next bucket with
-1, a value the kernel already knows to skip. - #4, a warmup exception that turned into a permanent hang instead of an error. Padding every call unconditionally broke batches over 64 tokens, which take a different orchestrator path and reject the padded shape. That raised an exception inside warmup/capture, and the engine’s inter-process broadcast just swallowed it as an idle wait instead of propagating it. Two hangs that looked separate turned out to be this same bug, reproduced offline with a 33-case kernel sweep. Fix: only pad calls that were already decode-sized.
- #5, KV pool undersized for the advertised context. At the default memory utilization, PIECEWISE graph accounting left the KV pool about 0.14 GiB short of what 1M context needs. Fix: raise
--gpu-memory-utilization.
Layer 2: the machine lying to the software about itself
- #6, GB10’s unified memory is invisible to NVML.
get_device_total_memory()raisedNVMLError_NotSupported. Falling back to PyTorch’s own memory query, the two otherwise identical Sparks reported 130,663,235,584 and 130,663,231,488 bytes, a 4 KiB difference that had to be normalized away (both ranks round to 124,610 MiB) before the two nodes could agree on anything downstream. - #7, a nested list mistaken for a flat one.
runner.attn_groupsislist[list[AttentionGroup]], and code that iterated it as a flat list crashed with'list' object has no attribute 'backend'. Fix: flatten before use. - #8, a persistent cache keyed on its own volatile output. An adaptive startup-profile cache, meant to skip the expensive graph/profile phase on a warm restart, accidentally included the resolved KV-allocation layout (block count, offsets, buffer sizes) inside its own cache key. That layout is intentionally nondeterministic across boots: one cold run allocated 1,399,106 KV tokens, an otherwise identical restart allocated 1,429,947. So the cache missed on every single restart and silently re-ran the full profile it was supposed to skip. Fix: pull just the volatile allocation object out of the key and keep everything else (KV specs, dtype, block size, model config, hardware, kernels, graph sizes). A regression test now checks the fingerprint stays the same when the simulated allocation is doubled.
The remaining five findings are the ones that took the longest to find, and the ones that mattered most, because none of them crashed anything: the KV-cache dtype that turned out to be mislabeled, the indexer stall, the tiering disagreement, the block-zeroing stride bug, and the CUDA-graph stride bug. The symptoms ranged from full gibberish and bursts of non-Latin characters, to raw unformed tool-call markup leaking into visible content, down to replies that read as completely coherent and were just quietly wrong. That last one is the dangerous mode. This model is strong and precise when the stack underneath it is healthy, so a degraded reply doesn’t look degraded. It looks like an ordinary answer that happens to be wrong. Each of the five gets its own section below, with the address-level math of what was actually happening in memory.
Finding #9: a KV-cache dtype that is not what it says
On this SM121 sparse-MLA path only two KV-cache dtypes actually work: fp8_ds_mla and nvfp4_ds_mla. bf16/fp16 hit a hard assertion, "DeepseekV4 fp8_ds_mla layout only supports fp8 kv-cache, got bfloat16", because the SM121 sparse-MLA kernels only exist for uint8-packed layouts.
The first corruption I chased looked like a precision problem. fp8_ds_mla was clean at short context (70.2 tok/s, 85–89% draft acceptance), but at 40K–77K tokens it started injecting stray “#” tokens mid-sentence, which escalated into full collapse: code fragments, phrase loops, language mixing. The metrics were unambiguous. Draft acceptance crashed to 6–10%, with rejection positions 2 through 5 sitting at exactly 0.000, meaning the draft head and the target model had stopped agreeing entirely. An A/B against nvfp4_ds_mla with CUDA 13.3 held constant came back clean, 4 probes out of 4. That looked like enough evidence, so I reverted to nvfp4_ds_mla in production and wrote it up as a precision regression in the fp8 sparse-MLA decode path.
It wasn’t enough evidence. A later audit of deepseek_v4/attention.py found that nvfp4_ds_mla maps onto the exact same uint8, 584-bytes-per-token packed layout as fp8_ds_mla. Same UE8M0-FP8 quantization kernel writing it, same FlashInfer SM120 kernels reading it. The only runtime difference between the two labels is page alignment:
\text{bytes/token: main}=584,\ \text{SWA}=512,\ \text{indexer}=512 \quad(\texttt{fp8\_ds\_mla}) \text{vs. alignment}=576 \text{ everywhere} \quad(\texttt{nvfp4\_ds\_mla})
Same bit format on both arms of the A/B. The four-probe comparison wasn’t a precision test at all, and it ran before finding #12 below was known, with concurrent traffic present. So the result was confounded by a bug that had nothing to do with KV dtype. The lesson goes beyond this one flag: a name on a KV-cache option is a claim about behavior, not a guarantee of it. The only way to know which bytes are actually on the wire is to read the kernel that writes them.
Finding #10: a stalled indexer at very long context
The DSA indexer scores candidate attention positions with an MQA-logits computation. DeepGEMM has no arch-12 kernels for sm_121a, so this step falls back to a pure PyTorch implementation, _fp8_mqa_logits_torch. At roughly 450K+ prompt tokens, that fallback pinned a worker inside itself for over 30 minutes. GPU utilization sat at 96%, the engine’s own status logs went quiet, and the HTTP API kept answering, which makes it look like a hang from the outside when it’s actually a very slow path grinding to completion. py-spy sampling of the stuck worker is what actually surfaced this. Nothing in the request-level logs told it apart from a genuine deadlock.
The actual bug was a dispatch error. Requests with clean_logits=False, a legitimate and common mode, got routed into the slow torch fallback instead of the working fp8_mqa_logits_triton kernel that should have handled them. The fix was a one-line dispatch correction plus a regression test that checks the routing. I validated it against a 468,540-token needle search that had never completed before: 498 seconds, correct answer. This went upstream as a cross-fork PR into jasl’s #41834 branch, plus a field-report comment on vllm-project/vllm#41063, citing three ROCm issues (#48576, #41963, #52109) as likely the same silent-fallback problem on a different vendor’s SM12x-equivalent path.
Finding #11: three sparse-attention builders disagreeing about one boundary
Sparse-MLA on this port runs across three builders: the indexer, the sliding-window attention path, and the main sparse-MLA path. All three read the same topk_indices_buffer, sliced at a boundary each one computes on its own: num_decode_tokens. The port had cherry-picked a fix, sparse_short_extend_tiering(), for how that boundary should treat a “short extend” (a prefilling row with six tokens or fewer), but it only got wired into the indexer. The other two builders stayed on the old default of always treating short extends as decodes.
Under an ordinary batch, all three agree. Under a batch that mixes a normal prefilling row with a short-extend row, they don’t: the indexer computes one value of num_decode_tokens, the other two compute a different one, and the co-scheduled prefill chunk ends up attending to positions shifted by that disagreement. The wrong attention output for that chunk gets written into later layers. Because it looks like a plausible continuation instead of garbage, it gets written into the prefix cache and stays wrong until the process restarts and the cache is gone with it. That’s exactly the signature of “the model loops after hours, and a restart fixes it.” Given how the DSpark draft group schedules things, this only comes up from budget-starved chunks with six tokens or fewer left in an 8,192-token budget, which puts the estimated collision rate around 0.07% per prefill. Low frequency, but a real defect. The fix was a single upstream commit that aligns all three builders’ tiering logic, cherry-picked onto the four active fork branches.
Finding #12: the real root cause, a stride bug in the block zeroer
This turned out to be the bug the fp8-vs-nvfp4 A/B was actually chasing, without anyone knowing it. DeepSeek-V4’s packed KV layout stores, for each physical block index b, one contiguous segment per attention layer \ell \in \{0,\dots,L-1\}, each segment s bytes wide. So the full row width for one block is
S \;=\; \texttt{kv.stride(0)} \;=\; L \cdot s
vLLM 0.27.1’s KVBlockZeroer (vllm/v1/worker/utils.py), when it allocates a fresh block for a specific layer \ell, is supposed to clear only that layer’s own slice, \big[\,bS + \ell s,\ bS + (\ell{+}1)s\,\big). Instead it took its zero-fill length from kv.stride(0) itself, the width of the entire multi-layer row, and wrote S bytes starting from that same offset. Here’s the address line, with the layers of block b correctly zeroed on the left and the one bad write on the right:
\underbrace{[\ell{=}0]\ [\ell{=}1]\ \cdots\ [\ell{=}L{-}2]}_{\text{zeroed correctly, one segment }s\text{ at a time}}\ \ \overbrace{[\ell{=}L{-}1\text{ of block }b]\ \ [\ell{=}0\text{ of block }b{+}1]}^{\text{one write of length }S\text{ starting at }bS+(L-1)s}
Because the write length S is wider than the single segment s it was supposed to cover, zeroing the last layer of block b runs S-s bytes past the true end of block b’s row and wipes out nearly the entire first segment of the next physical block, b+1. This only bites when three or more requests prefill at the same time: a fresh block index b gets allocated to one request right when block b+1, already written, belongs to another live request whose data quietly vanishes.
The symptom matches “coherent but wrong” almost exactly. One 256-token block in an otherwise fine document answers incorrectly (a plausible fabrication, not noise), its neighbors are unaffected, the wrong block sticks around because it’s living in the prefix cache, and a restart clears it because the cache goes with it. The reproduction numbers make the concurrency threshold obvious: 8 concurrent documents corrupted 6 of 7 shared blocks, 4 documents corrupted 3 of 4, 2 documents corrupted 0 of 2 (below the 3-way threshold), and a single document alone was always clean. Capping max_num_seqs to 2 as a stopgap brought a 4-document run down to 0 corrupt. The real fix was cherry-picking three upstream commits merged after the 0.27.1 cut (#50276, #51749, #52058) onto all four fork branches. Afterward, the same 4-document run stayed at 0 of 4 with max_num_seqs back at 12, and an 8-concurrent run with sidecar decode traffic came back 0 of 8 corrupt over 714 block reads.
Finding #13: a second stride bug, this time between capture and replay
The last bug only showed up on an instance that had been serving for a while. After 17 hours warm, the same temperature-0 question against the same cached KV gave soft, visibly wrong logits when the request ran alone (lp ≈ -0.74 and -1.49 on the top two candidates, drifting a bit run to run), and sharp, correct logits (lp ≈ -0.000) whenever any neighboring request shared the batch. Right after a fresh restart, the alone case was sharp too. Sampling parameters didn’t matter here; the argmax itself was wrong, not just the temperature. On the same degraded instance, a plain 1K-token solo request eventually crashed the worker with an indexSelectSmallIndex device assertion. Because the process exited with status 0 instead of a failure code, systemd’s Restart=on-failure never kicked in.
A targeted trigger reproduced the exact corruption seen in real usage: raw <|DSML|tool_calls> markers leaking into visible content, language mixing, code fragments, bursts of “#”. The trigger was three concurrent ~44K-token thinking requests plus one short request. The same three long requests without the short one stayed clean, which pointed at something in how the decode kernel handles rows across a mixed batch, not at long context on its own.
The root cause was a second stride mismatch, this time between CUDA-graph capture and runtime replay in the C128A decode path. sparse_mla.py computes active_topk_width from the live batch’s max sequence length (128, 256, or 512 for an ordinary batch), but the FULL-cudagraph capture for this kernel fixes its row stride once, at capture time, using max_model_len, which works out to 8,192. Let t index a row within a decode step’s batch, where t=0 is the accepted token and t \ge 1 are the five speculative rows from the k=5 MTP draft head. Here’s the captured kernel and the runtime builder side by side for the first few rows:
\begin{array}{c|ccccc} t & 0 & 1 & 2 & 3 & 4\\ \hline \text{addr}_{\text{capture}}(t) = t\cdot 8192 & 0 & 8192 & 16384 & 24576 & 32768\\ \text{addr}_{\text{runtime}}(t) = t\cdot w,\ \ w{=}128 & 0 & 128 & 256 & 384 & 512 \end{array}
Row t=0 lines up by coincidence. Every draft row t \ge 1 gets read by the captured kernel from an address the runtime builder never wrote on this step, because w never equals 8192 for any batch shape actually seen after warmup. What the captured kernel finds there instead is whatever the previous replay of that same buffer left behind. Right after a fresh capture that memory is still -1, a harmless placeholder, so a brand-new instance passes every guard. But once a later batch has legitimately written past offset 8192, which takes concurrent long-context traffic (hence “only after hours warm”), those stale bytes belong to another request’s compressed-KV slot ids. That one mismatch explains every symptom above. Soft and wrong when run alone, because the stale bytes are just noise. Sharp when run with a neighbor, because only the alone path replays the polluted batch-1 graph. The crash, because a NaN logits row sent the draft head’s embedding gather to an out-of-range index. The language mixing, because the stale bytes were literally another conversation’s identity leaking into this one’s decode step.
The fix pins active_topk_width to the same capture-time constant the graph was built with (c128a_max_compressed) instead of recomputing it from batch shape, which closes the gap between \text{addr}_{\text{capture}} and \text{addr}_{\text{runtime}} for every t. It shipped with a regression test that fails on the unfixed tree, and it’s cherry-picked onto all four active fork branches. Validation: three solo probes came back sharp, 12 of 12 at lp = -0.000. Two full rounds of the exact trigger pattern (three 44K-token thinking requests plus one short request, run four-way concurrent) came back clean 12 of 12, no DSML leakage, no non-Latin corruption. And a log fingerprint check across every request since the restart showed only the two legitimate stride widths, 512 and 8,192, ever appearing. The mismatch this bug depended on has no path left to occur.
What actually gates a change now
None of this would have been findable without holding one variable constant at a time, and without treating a clean four-probe A/B as the start of an investigation instead of the end of one. A few concrete practices came out of the week:
- Guard 4, concurrent-prefill KV block integrity: three or more documents prefilled together, then a per-block read-back against the shared prefix cache. This is the only test shape that ever caught the block-zeroer bug (finding #12). Anything at two concurrent requests or below stayed clean by construction.
- Guard 5, a margin probe run both alone and with a neighboring request. The C128A stride bug (finding #13) was invisible to any test that only checked the alone case right after restart and never came back to it hours later, or that only ever checked the neighbored case.
- A needle ladder up to a three-needle 44K-token probe, an acceptance canary on draft/target agreement, and a puzzle-solving smoke test, all in
quality-guards.md, run after any change to vLLM, CUDA, or drivers. - A reusable
e2e-battery(quick/full) covering the same ground end to end, always launched detached (setsid nohup, its own log file) so an interrupted session can’t take a running load test down with it.
Two operational details cost real debugging time before I understood them, so they’re worth writing down. The systemd unit for this service, vllm-deepseek-mxfp4@, runs with Restart=on-failure. A manual pkill and relaunch gets raced by systemd bringing the old configuration back about 60 seconds later, so every restart during an experiment has to go through systemctl, never a bare kill and relaunch. And GB10 exposes no wattage cap at all: nvidia-smi -pl is unsupported and there’s no ACPI power limit. So the only thermal lever available is an SM clock cap, running as a boot-enabled service on both nodes.
Where this goes next
port-0271 stays the staging branch. The goal is a PR to vLLM main that makes DeepSeek-V4 Flash work on DGX Spark out of the box, written to upstream standards from the start: debug and instrumentation commits kept isolated so they drop cleanly on rebase, each fix commit message naming the specific GB10/SM121 constraint it addresses. The cross-fork PR into jasl’s #41834 and the field report on vllm-project/vllm#41063 are both open. A smaller goal on the side is a PR adding a no-container venv path to the DSpark recipe repository this whole thing started from.
The bigger piece of unfinished work is making NVFP4 experts genuinely native instead of falling back through Marlin MXFP4 the way the current port does. That’s blocked upstream on DeepGEMM #372, no arch-12 expert-scale packing, and the DeepGEMM maintainers don’t have SM120 hardware of their own to test a fix against. Two GB10 nodes and a serving stack that already knows how to reproduce its own corner cases is exactly the validation capacity that issue is missing.
Five of the thirteen findings were loud: crashes and hangs during bring-up, layer 1 in the diagram above. Eight were quiet: three bookkeeping bugs that only wasted time, plus five correctness bugs that produced fluent, plausible, wrong output and needed concurrency and uptime just to show up at all. My first two explanations for the quiet bugs, a precision regression in one KV dtype and a numerics failure in the indexer, were each wrong or incomplete once I actually measured them against a controlled A/B. Getting a new model architecture correct on hardware it was never validated against turned out to mean thirteen bugs, not one, and each one only became visible once I had a test that could actually see it.